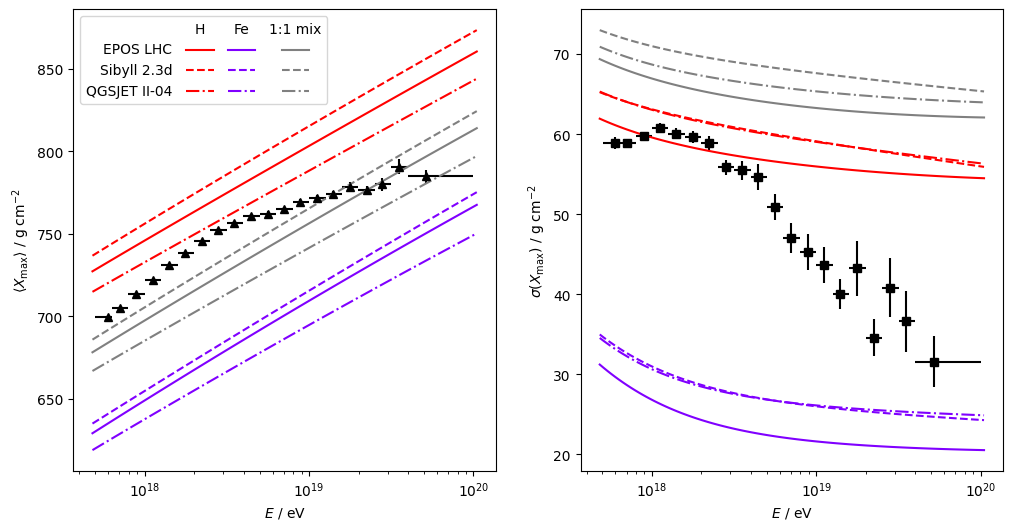
matrix legend is simply a plot legend for a cartesian product of two label sets (models, parameter values, etc). i often want to create this kind of thing to save space and show the cartesian-product-ness of the plots explicitly, but so far i have only seen people do that manually. so, in a couple of hours of tweaking Matplotlib’s Legend class i managed to get it to auto-magically produce the following
i’m yet to test it in more real-world scenarios, but it is fairly thin and should therefore play well with most other Matplotlib features.