here’s the original cosmic rays spectrum plot by Carmelo Evoli:
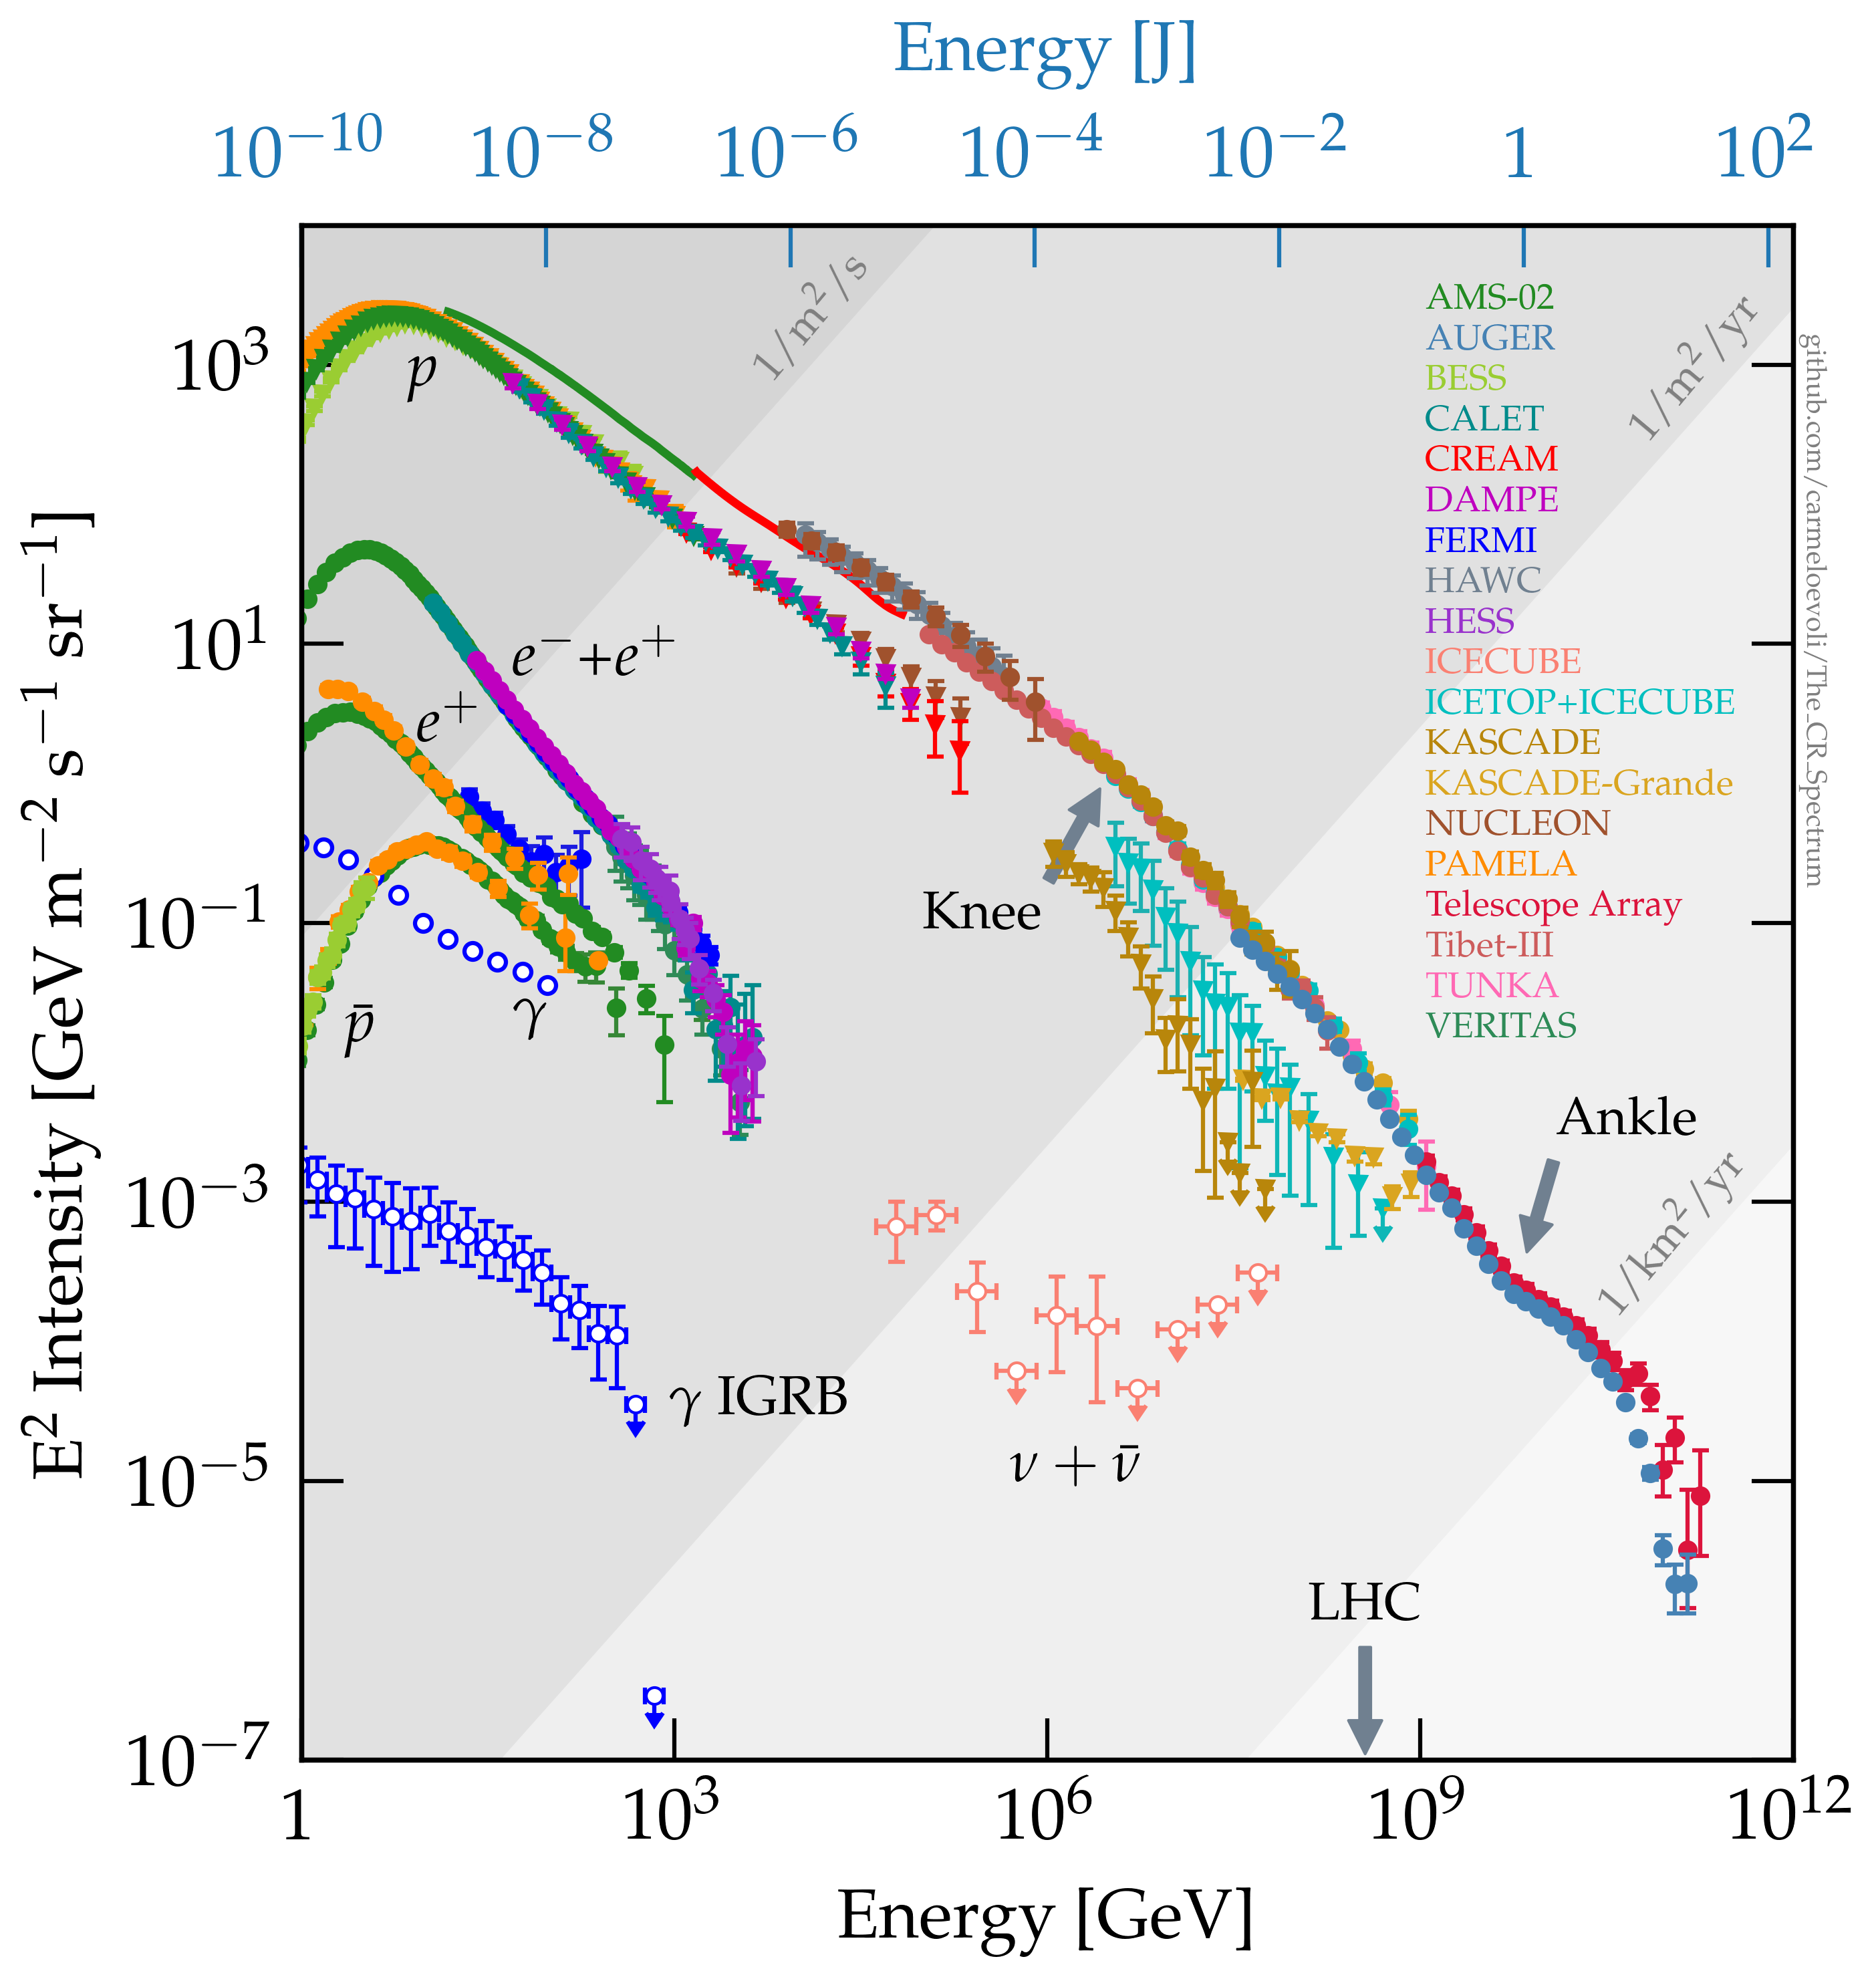
it is very nice, but a little bit crowded already, and it still misses some datasets. there is a natural upper limit to how much information can fit into a static PDF. i have long been thinking about browser-based visualizations for scientific data presentation, and decided to give it a go. basically, i just compiled all the plot’s data to a JSON document and wrote some Javascript to render it using Plotly.
here is the same plot displayed in the browser. the nice thing is that it is completely static and self-contained — libraries are loaded from CDN.
besides the ability to toggle different experiments on and off, the only real innovation with respect to the original static plot is the ability to change the power of E the intensity is multiplied by. this allows one to dynamically make the plot informative in different energy ranges, e.g. to set the power to 3 and zoom to the UHECR region, then change it to 2.8 and see near-knee features as clearly as possible.